
You are using an out of date browser. It may not display this or other websites correctly.
You should upgrade or use an alternative browser.
You should upgrade or use an alternative browser.
Coronavirus in the UK - news, lockdown and discussion
- Thread starter Sasaferrato
- Start date
elbows
Well-Known Member
When a professor of global public health can't interpret the official numbers we're probably not in a good place.
Main way to attempt sensible interpretation at this stage is to have to look at the data that gives positive test numbers by date of test specimen instead of reporting date.
Until this recent cockup I only went on about this sort of case data once or twice because there wasnt much added value in looking at that as opposed to daily reported cases. Since daily reported cases, although they've always included quite a lot of positive tests from earlier dates, did act as a reasonable proxy for levels of positives that day, with the advantage that they felt less laggy. I wish I could explain this better.
Anyway since this latest cockup has spoiled the shape of the data by reported date, the data by specimen data now serves an immediately useful purpose.
So yesterday I presented a chart where blue was all the positive cases by specimen date that had been reported on the dashboard up to and including Friday. Green showed the cases that were reported on Saturday, the first day of the cockup correction reporting of cases. Today I have added this evenings reported cases in orange, and also made the graph go back to early July to give some additional context.
The first conclusion I would reach is that even though yesterdays high number was described as being that high due to catching up with the backlog, data for positive tests by specimen date shows that by the end of September they have already picked up more than 10,000 cases a day by this other measure, and I dont know how much further those numbers for those dates will grow further in the coming days.

Last edited:
two sheds
Least noticed poster 2007
I'd at first thought that those past cases had just distorted the numbers, but I presume the numbers are correct and it's just the shape of the graph that is distorted - the slope should have been steeper over the last few days to reach the figure we have now? 
wemakeyousoundb
hopefully not gimboid
let's recap:
governement + Big IT Project = fail
is a given
yes?
governement + Big IT Project = fail
is a given
yes?
elbows
Well-Known Member
When Triggle was trying his best to spin against the Whitty/Vallance 50,000 exponential example chart, he attempted to show that if our cases grew at the same rate as France, we'd only be up to 10,000 cases per day by October 13th, not 50,000. Well by using the specimen date version of the data we can see that 10,000 was breached even before September ended.
Not that I have a number in mind for where we will be at by October 13th. Partly because as the test system presumably continues to groan under the strain, a continuing increase in the percentage of tests that come back positive will likely be required in order for the system to stand a chance of keeping up with ever larger number of positives.
Not that I have a number in mind for where we will be at by October 13th. Partly because as the test system presumably continues to groan under the strain, a continuing increase in the percentage of tests that come back positive will likely be required in order for the system to stand a chance of keeping up with ever larger number of positives.
elbows
Well-Known Member
By the way people dont need me to see graphs of cases by specimen date, its right there as always inside the cases section of the official dashboard.

The only thing my graphs are adding to the picture is a proper sense of how the number reported in recent crazy days relates to what date the test specimens were actually taken, via the colour coding that I did.
I will keep doing my graphs anyway until the daily data picture seems a bit more settled.
SheilaNaGig
Break requested
.
Last edited:
cupid_stunt
Where's the bloody sun?
The virus is spreading faster than the government would like to admit, so data is being manipulated...
I don't think so, it would have been better to have had the correct figures for last Wednesday's Downing Street press briefing, in order to drive home how bad the situation is, and would have fitted better with the example used the week before, about how things could go if cases doubled every week.
Also there's no logic in suppressing case numbers for a few days, and then making a mockery of themselves by having to play catch-up.
I am filing this under cock-up rather than conspiracy.
redsquirrel
This Machine Kills Progressives
This.I am filing this under cock-up rather than conspiracy.
There's some right tin-foil hat stuff doing the rounds at the moment
Spandex
A crazy bulbous punchbag of sound
I'm sure everyone who's worked with data has had an oh fuck moment when they realise that they haven't referenced a column on a spreadsheet or something and everything they've done since is rubbish. This is just a very public, very humiliating and (with the contact tracers not being notified) potentially deadly example.Has anyone actually got any idea what the fuck is going on..?
I suspect someone at PHE near had a heart attack on Friday night when they noticed they'd bollocksed up the data and had been giving the wrong figure all week. That'd have been followed by anxious sweats as they started the emails flying saying 'there's been an error in the data'.
I don't see any conspiracy here, just a snafu data error messing up the most watched number in the country.
purenarcotic
Conveniently Pocket Sized
This makes the Government look even more incompetent than usual, so I can’t see how it advantages them to have deliberately engineered this in some capacity.
This really is gonna be such a shit winter.
This really is gonna be such a shit winter.
brogdale
Coming to terms with late onset Anarchism
Must have felt very familiar for TalkTalk’s Dildo HardonI'm sure everyone who's worked with data has had an oh fuck moment when they realise that they haven't referenced a column on a spreadsheet or something and everything they've done since is rubbish. This is just a very public, very humiliating and (with the contact tracers not being notified) potentially deadly example.
I suspect someone at PHE near had a heart attack on Friday night when they noticed they'd bollocksed up the data and had been giving the wrong figure all week. That'd have been followed by anxious sweats as they started the emails flying saying 'there's been an error in the data'.
I don't see any conspiracy here, just a snafu data error messing up the most watched number in the country.
LDC
On est tous des pangolins
The virus is spreading faster than the government would like to admit, so data is being manipulated...
No, that's tinfoil hat bollocks.
cupid_stunt
Where's the bloody sun?
The closure of pubs and a ban on social contact outside household groups could be implemented locally or nationally to deal with soaring infections, now at a level higher than the first wave peak.
This sort of slack, inaccurate & scaremongering reporting pisses me off.

FFS, it was estimated there was over 100k infections a day at the peak of the first wave, we are nowhere near that.

Coronavirus - all you need to know as North could face lockdown
Boris Johnson is said to be looking at further restrictions in parts of the country after criticism that local lockdowns are failing to curb record numbers of daily infections
 www.mirror.co.uk
brogdale
Coming to terms with late onset Anarchism
Though it is fair to say that Government figures, Gove included, wasted no time in going to the press with the line that the erroneously reduced daily figures over the last week demonstrated that their policies were "working".No, that's tinfoil hat bollocks.
Nothing TFH to point out that they used the, then unknown (?), error to their political advantage.

Ax^
Silly Rabbit
Can someone recap for me. What results have been miscounted? Can't see anything in the news.

Covid: 16,000 coronavirus cases missed in daily figures after IT error
Those who tested positive were told and their contacts are being traced, the prime minister says.
www.bbc.co.uk
")
cupid_stunt
Where's the bloody sun?
Can someone recap for me. What results have been miscounted? Can't see anything in the news.
What? It's all over the news, and in the link I've posted just above.
If Friday's data from the CSS is right - and there's no reason to think it isn't - they might well be tbf.Though it is fair to say that Government figures, Gove included, wasted no time in going to the press with the line that the erroneously reduced daily figures over the last week demonstrated that their policies were "working".
Spandex
A crazy bulbous punchbag of sound
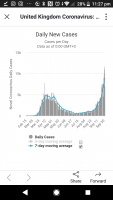
That data says that the increase in cases had flattened in the 4 days leading up to 27 September.If Friday's data from the CSS is right - and there's no reason to think it isn't - they might well be tbf.
Looking at the Worldometers new UK cases chart, which has attempted to sort out the weekend's data fuck up, you can see new cases flatten on those 4 days, before leaping massively since.
As always, I guess we have to wait, watch and see what's going on...
brogdale
Coming to terms with late onset Anarchism
Maybe, but the Mail's Gove piece went out in Saturday's edition, so written on Friday (?) when they'd been looking at the erroneously reduced data for a whole week.If Friday's data from the CSS is right - and there's no reason to think it isn't - they might well be tbf.
Sure, but the CSS is an independent survey rather than being based on government test data, so it's numbers aren't affected by the data fuck up.That data says that the increase in cases had flattened in the 4 days leading up to 27 September.
Looking at the Worldometers new UK cases chart, which has attempted to sort out the weekend's data fuck up, you can see new cases flatten on those 4 days, before leaping massively since.
As always, I guess we have to wait, watch and see what's going on...
Spandex
A crazy bulbous punchbag of sound
I know they're different data sets. Both show a flattening of the increase of new cases in the four days up to 27/10. But the government test data (might) show a big increase since, while the CSS data stops there. We'll need to wait for new CSS data to see if they find the flattening continue or if they see a big increase too.Sure, but the CSS is an independent survey rather than being based on government test data, so it's numbers aren't affected by the data fuck up.
In other words, there's mixed data at the moment and we'll have to wait to see what's happening over the next week. I don't feel very optimistic, but would be delighted if the testing data is just a blip caused by the data fuck up.
I think there's a lot going on with the daily testing data - not just this latest clusterfuck, but issues discussed passim - that make it a really unreliable measure this close in of what's going on, so I don't really pay much attention to it. I find the prominence given to the daily testing numbers here when all these issues are already known about - to the exclusion of more useful and robust data from elsewhere - a bit odd tbh.I know they're different data sets. Both show a flattening of the increase of new cases in the four days up to 27/10. But the government test data (might) show a big increase since, while the CSS data stops there. We'll need to wait for new CSS data to see if they find the flattening continue or if they see a big increase too.
In other words, there's mixed data at the moment and we'll have to wait to see what's happening over the next week. I don't feel very optimistic, but would be delighted if the testing data is just a blip caused by the data fuck up.
The CSS has a huge number of participants, and them recording a flattening now - about when you'd expect any effect of recent lockdown changes to kick in, if they're to do anything - is significant IMO.
teuchter
je suis teuchter
Also no one seems to be taking into account the fact that the number of tests being done is gradually going up - it's the proportion of them that are positive that is important, rather than the bare numbers of positive results.I find the prominence given to the daily testing numbers here when all these issues are already known about - to the exclusion of more useful and robust data from elsewhere - a bit odd tbh.
elbows
Well-Known Member
Also no one seems to be taking into account the fact that the number of tests being done is gradually going up - it's the proportion of them that are positive that is important, rather than the bare numbers of positive results.
Its important to check percentage positive in order to eliminate the arguments of those who would claim that more positive results is just because of more testing.
So far I'd say that all around the world when the numbers go in a direction that cause this sort of attention, the percentage positives at those times in those places confirm that its not just a result of more testing, and that a real notable rise in infections is behind it.
Therefore I see nothing wrong with the focus on number of positive tests as a slightly simplistic but very useful guide. Just so long as some people keep an eye on percentage positives and tell everyone if something important shows up in that side of the data.
Similar threads
- Replies
- 76
- Views
- 2K
- Replies
- 165
- Views
- 6K
- Replies
- 173
- Views
- 5K
- Replies
- 230
- Views
- 11K