
You are using an out of date browser. It may not display this or other websites correctly.
You should upgrade or use an alternative browser.
You should upgrade or use an alternative browser.
Brixton Liveable Neighbourhood and LTN schemes - improvements for pedestrians and cyclists
- Thread starter teuchter
- Start date
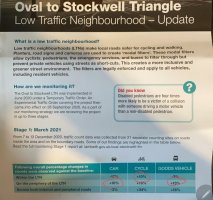
The Oval report shows decreased response times for inside the Oval LTN and it’s boundary roads. What other lies are the One groups and the right wing media constantly pushing for their pro-car agenda?
Do you have any data on trends in anecdotes ?
Jeanette Moo
Active Member
The Oval report shows decreased response times for inside the Oval LTN and it’s boundary roads. What other lies are the One groups and the right wing media constantly pushing for their pro-car agenda?
I love charts with no dates and no explanations, Really adds credibility
I love charts with no dates and no explanations, Really adds credibility
Hey Jeanette - it’s a screenshot from the report linked at the top of the thread. Maybe you could check that before dismissing?
BigTom
Well-Known Member
I love charts with no dates and no explanations, Really adds credibility
full methodology is in the actual report which is linked to from that twitter account: https://beta.lambeth.gov.uk/sites/d... to Stockwell Stage 2 Monitoring Report_0.pdf
for the fire service, the monitoring period was
• The London Fire Brigade responded to 1637 emergency incidents in Lambeth during our monitoring period October 2020- May 2021, where we could identify the exact location and the response times.
• We compared the monitoring period data with a baseline collected between the period of March 2019 to February 2020.
this is on page 32 of the report.
Jeanette Moo
Active Member
full methodology is in the actual report which is linked to from that twitter account: https://beta.lambeth.gov.uk/sites/default/files/2021-09/Oval to Stockwell Stage 2 Monitoring Report_0.pdf
for the fire service, the monitoring period was
• The London Fire Brigade responded to 1637 emergency incidents in Lambeth during our monitoring period October 2020- May 2021, where we could identify the exact location and the response times.
• We compared the monitoring period data with a baseline collected between the period of March 2019 to February 2020.
this is on page 32 of the report.
You're right. It is. Pre-pandemic vs post pandemic
"It is important to recognize other factors that could have led to the reduction in average response times such as traffic levels due to COVID-19"
BigTom
Well-Known Member
You're right. It is. Pre-pandemic vs post pandemic
"It is important to recognize other factors that could have led to the reduction in average response times such as traffic levels due to COVID-19"
Yeah, the traffic volume data is normalised by comparing traffic volume changes post-pandemic in areas without LTN treatments in order to isolate the effect of the LTN but the fire response times isn't.
Jeanette Moo
Active Member
Yeah, the traffic volume data is normalised by comparing traffic volume changes post-pandemic in areas without LTN treatments in order to isolate the effect of the LTN but the fire response times isn't.
I think a chickens are being counted too soon. a good comparison would be from now.
beesonthewhatnow
going deaf for a living
"We want data"
"Noooo, not that sort"
"Noooo, not that sort"
Jeanette Moo
Active Member
"We want data"
"Noooo, not that sort"
...because ppl really do trust the crap that lambeth put out!
BigTom
Well-Known Member
You'll get that data in time anyway.I think a chickens are being counted too soon. a good comparison would be from now.
I think you need to compare pre-pandemic, but it's better if you can normalise that against similar areas with LTN treatments.
Jeanette Moo
Active Member
I love the complete faith of the antis - they believe pollution has increased, congestion is terrible & emergency services are delayed despite any evidence and lots that argue against. Keep the faith! The divine right of drivers!
Well it's not like the data is poiting to everything being good.
Lambeths latest pollution report shows only a 7% drop in pollution on Brixton road....during a pandemic.
TFL SCOOT data, which has been monitoring for years and gives a true baseline, shows congestion is up massively and lambeth chose not to use this data in any of their reports.
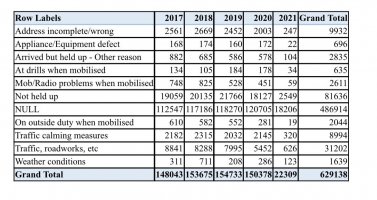
There has been a 300% increase in incidents of crews being delayed by 'traffic calming measures' in 2020 compared to 2019. Not averages which are had ot pin down because ambulances could come from anywhere AND we have the pandemic.
You cant claim one side is being closed minded and then be close minded yourself.
Well it's not like the data is poiting to everything being good.
Lambeths latest pollution report shows only a 7% drop in pollution on Brixton road....during a pandemic.
TFL SCOOT data, which has been monitoring for years and gives a true baseline, shows congestion is up massively and lambeth chose not to use this data in any of their reports.
There has been a 300% increase in incidents of crews being delayed by 'traffic calming measures' in 2020 compared to 2019. Not averages which are had ot pin down because ambulances could come from anywhere AND we have the pandemic.
You cant claim one side is being closed minded and then be close minded yourself.
Brilliant!

Jeanette Moo
Active Member
Brilliant!
Thanks!
Thanks!
No problem - credit where it’s due.
Especially love the pollution has decreased so LTNs must be increasing it. Masterful!
beesonthewhatnow
going deaf for a living
Oh dear 
BigTom
Well-Known Member
I mean you shouldn't just accept any stats without being critical of them.
The pollution stat is meaningless without a comparison to similar roads which haven't been affected by LTN treatments. I also don't know what dates that 7% drop is measured between. Who knows if 7% is a good or bad drop, if there's been general fall in traffic over the same time period?
There might be good reasons for excluding the SCOOT data but 100% politicians will look for stats that make them look good. That said, it seems to me that statistically speaking it's best to have the same monitoring methodologies for all roads within the LTN area and the SCOOT data will presumably only cover TfL managed roads so using it makes figures which aren't properly comparable with roads that aren't TfL roads. I'm certainly no expert on this though.
Ambulance services generally support LTNs and that 300% figure, you need to look at the detail of that. It might be 1 to 3, and those might have been early on when drivers forget about the changes. Or it might be that they are all around one LTN filter that can be changed to an ANPR controlled filter to remove the issue. Really response times are the best way to look at this, but you need to make at least some attempt to normalise them to control for general background changes in traffic levels - I don't know how possible this is with fire service response times, and it seems the other services are not monitored so closely.
No matter how you try to do this, it's all complicated hugely by the ongoing changes of the pandemic/post-pandemic period. Even the most honest statistical methods are going to have flaws. You need to acknowledge those flaws and take the best evidence available.
For me, in terms of the oval report, that's the traffic drops, which are normalised against other areas, and consistent in their data collection methodology.
sparkybird
ask the bird...
I recall that one of the problems comparing traffic data on A roads is that volumes are affected by many factors, LTNs being only one of them, so it's nigh on impossible to single out the LTN impact.
Jeanette Moo
Active Member
I mean you shouldn't just accept any stats without being critical of them.
The pollution stat is meaningless without a comparison to similar roads which haven't been affected by LTN treatments. I also don't know what dates that 7% drop is measured between. Who knows if 7% is a good or bad drop, if there's been general fall in traffic over the same time period?
There might be good reasons for excluding the SCOOT data but 100% politicians will look for stats that make them look good. That said, it seems to me that statistically speaking it's best to have the same monitoring methodologies for all roads within the LTN area and the SCOOT data will presumably only cover TfL managed roads so using it makes figures which aren't properly comparable with roads that aren't TfL roads. I'm certainly no expert on this though.
Ambulance services generally support LTNs and that 300% figure, you need to look at the detail of that. It might be 1 to 3, and those might have been early on when drivers forget about the changes. Or it might be that they are all around one LTN filter that can be changed to an ANPR controlled filter to remove the issue. Really response times are the best way to look at this, but you need to make at least some attempt to normalise them to control for general background changes in traffic levels - I don't know how possible this is with fire service response times, and it seems the other services are not monitored so closely.
No matter how you try to do this, it's all complicated hugely by the ongoing changes of the pandemic/post-pandemic period. Even the most honest statistical methods are going to have flaws. You need to acknowledge those flaws and take the best evidence available.
For me, in terms of the oval report, that's the traffic drops, which are normalised against other areas, and consistent in their data collection methodology.
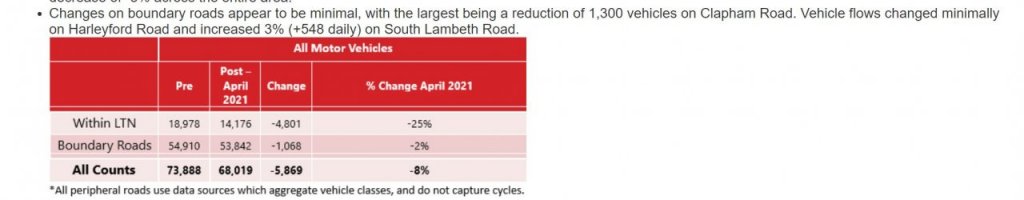
I don't think even Lambeth knows, or they are just trying to put out happy stats for the consultation
One one hand they say traffic is up 10% on the boundary rds, then they are saying oh look its 2% down actually
Attachments
BigTom
Well-Known Member
I don't think even Lambeth knows, or they are just trying to put out happy stats for the consultation
One one hand they say traffic is up 10% on the boundary rds, then they are saying oh look its 2% down actually
I think the first one is just the count from December 2020 whereas the second one is from the oval report includes data from April 2021 (I think it was april but I haven't memory checked the oval report), if that's the case I don't think there's any dishonesty there. In fact I think it shows the LTN is working, and over time as it beds in, you get a reduction in traffic. A short term rise followed by a long term drop is what pro-LTN groups expect to see.
nick
Pleomorphic Adenomas R us
a percentage rise on one road and a percentage decrease in another cannot be subtracted from each other to get the net percentage change. There may have been / will have been different base line absolute volumes upon which the changes were calculated
edited to change "can" to "cannot" - which is kind of important
edited to change "can" to "cannot" - which is kind of important
Last edited:
thebackrow
Considerably more Brixton.
I love this idea that because Scoot gives a slightly different picture that must be right and everything else wrong.Well it's not like the data is poiting to everything being good.
Lambeths latest pollution report shows only a 7% drop in pollution on Brixton road....during a pandemic.
TFL SCOOT data, which has been monitoring for years and gives a true baseline, shows congestion is up massively and lambeth chose not to use this data in any of their reports.
There has been a 300% increase in incidents of crews being delayed by 'traffic calming measures' in 2020 compared to 2019. Not averages which are had ot pin down because ambulances could come from anywhere AND we have the pandemic.
You cant claim one side is being closed minded and then be close minded yourself.
Googling "What is Scoot TFL" the first result says
London .. has an extensive network of SCOOT-controlled traffic lights, which use sensors to detect traffic and adjust the signal timings to manage queues and give buses priority if they are running late.
The second result is a response to an FOI which says:
Flow data is recorded based upon the number of vehicles recording passing over our on street detectors. The graphs attached show the change in flow during the dates mentioned above, measured from the vehicle detectors near each location, but due to the way the data is collected the absolute flow numbers are approximate. Congestion data is recorded based upon the percentage of time the detector is registering activity without breaks (suggesting a vehicle is stationary upon it)
so TfL say Scoot data is not a good measure, which might be why it hasn't been used. it's intended to automatically tweak traffic signal timings, not count vehicles.
And for Emergency service response times this is supposed to be London Fire Brigade response data (for the whole of London I think). Wrong address is recorded as the cause of delays as often as traffic calming measures and general traffic/roadworks much more often. From this thread where the head fo the ambulance service says LTNs are necessary.
Attachments
sleaterkinney
Well-Known Member
chowce5382 - any idea why your organisation is against street parties? This was Claverdale Rd yesterday and had absolutely nothing to do with the LTN.
beesonthewhatnow
going deaf for a living
They’re dinosaurs, facing extension soon and they know it.
Just full of hate. That Oxford account judging a Brixton street party that’s been happening for years - really nice - and chowce5382’s mates encouraging it. They don’t represent our communities.
chowce5382
Active Member
chowce5382 - any idea why your organisation is against street parties? This was Claverdale Rd yesterday and had absolutely nothing to do with the LTN.
As I’ve said again and again Ed, this is nothing do with me. If you called me a Blairite, I’d be very happy and comfortable with that.
As I’ve said again and again Ed, this is nothing do with me. If you called me a Blairite, I’d be very happy and comfortable with that.
Is any of it to do with you ?
Similar threads
- Replies
- 1
- Views
- 730
- Replies
- 5
- Views
- 795